In a discussion with @Somensi about excess deaths, I was puzzled by an apparent discrepancy between two sources that have both been reliable, insofar as I can tell:
- The covidtracking.com weekly data on cases, hospitalizations, and covid-attributed deaths.
- The laggy but solid CDC excess deaths counts/estimates.
Puzzle: December Covid vs Excess Deaths
The basic question from mid-December was how to reconcile this and this:
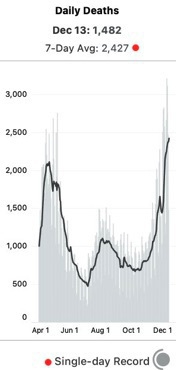 |
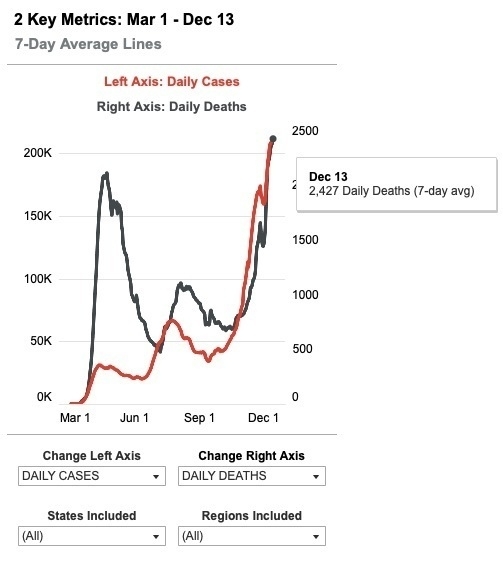 |
With this:
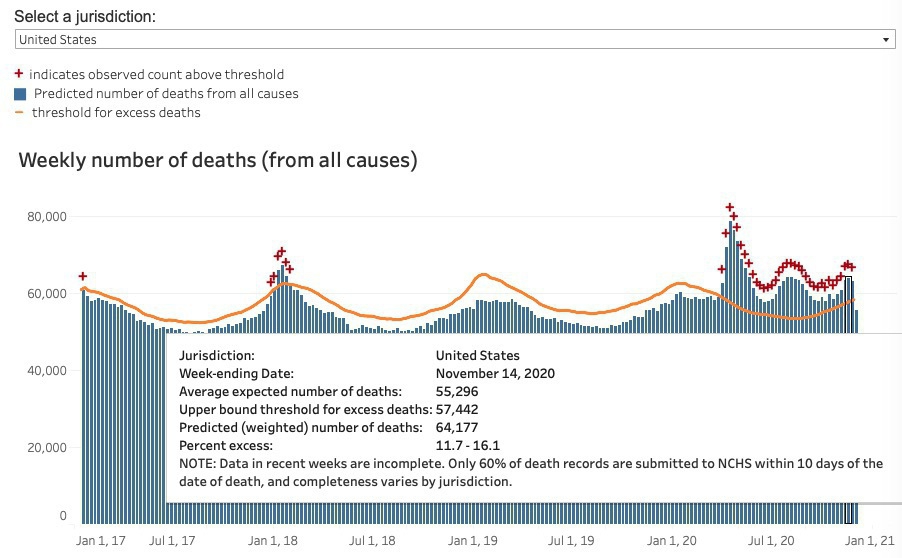
(Screenshots are from mid-Dec.)
In short, by early December it was clear that covidtracking.com had started diverging wildly from the CDC excess death counts. Two basic theories:
- covid-tracking was correct - CDC counts would catch up in a month or so.
- covid-tracking was wrong - this was an attribution blip.
There’s a lot of noise on the thread, but @Somensi, who I don’t know, was also looking at data, and citing a good source. Doomsters like me have been using CDC excess data since April as evidence that the pandemic was real and could not be simple relabeling of flu deaths. Here the same source is cited to say the December spike couldn’t be real.
People on both sides who knew the CDC data understood it had a lag of 4 weeks or so – because it relies on actual death certificates completing all their procedural checks and getting filed. In 2016 it took 10 weeks for 80% of certificates to get filed. CDC now claims it gets to 60% in ~10 days. (There are plenty of people who don’t get the lag – it seems even to have tripped up JHU’s Dr. Briand, at least in her headline claim that there were no excess deaths in 2020.)
Problem: covidtracking is the most thoroughly-vetted weekly data source in the US. They’ve tracked the CDC excess deaths (after lag) the rest of the year. And reliably, their cases –predict–> hospitalizations 4 weeks later –predict–> deaths a few weeks later. The December death spike followed that pattern. Plausibly, CDC was just lagging.
Problem: CDC 4 weeks back should be pretty good, and it looked nothing like April. As my correspondent said, CDC data “would have to be lagging by an unprecedented amount."
Resolved
It’s obvious once you see it.
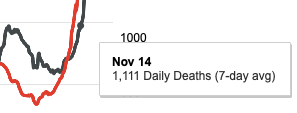
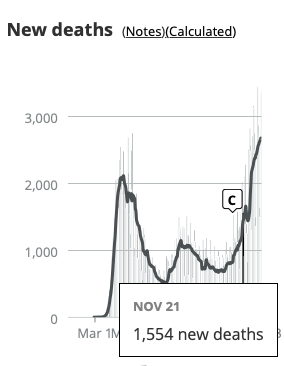
That death spike (swoop?) at the end is super fast. If you hover over the attributed deaths chart from covid-tracking, you find that the Nov. 14 cases are exactly in line with their July numbers, about half their April numbers. And in line with the mid-Nov. CDC numbers. The steep rise is mostly in the last 4 weeks.
Corroboration
As of Dec. 23, we can look at how the CDC data has changed. Data should be pretty complete through Nov. 21. We see that Nov. 14 is now about 1,000 higher than before (and than the July peak), and Nov. 21 about 2,000 higher than that.
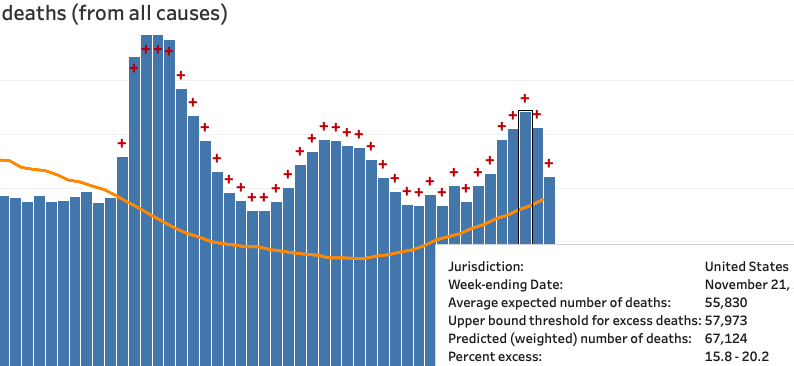
Not a swoop yet, but basically on par with the covidtracking chart week-for-week. Here that is again from today, highlighting Nov. 21. (The bold line is the 7-day moving average, a far better comparison than the daily total.)
Forecast
We should definitely expect the CDC excess deaths count for December to reach April levels.