[Edited 2021-02-02 to shorten and include Alexis' suggestion. -crt] [2021-05-23 Updated the CDC “excess death” numbers at the end. tl;dr they went up even more than required. 84,715 for the week of Dec. 26.]
In The Vaccine’s Race Against Time, Andrew Sullivan remembers his experience at the end of the US AIDS epidemic, and reminds us that “plagues … often finish strong.” It’s a good read.
At my church’s weekly service, we used to have general prayers like, “For all those suffering from COVID-19”. But since late autumn it seems we’ve had more specific prayers for parents, siblings, kids struggling with it. Half a dozen in recent weeks. Maybe dropping off now - let’s hope.
Happily the US is vaccinating, if unevenly. Sullivan urges us to continue other measures, because deaths after the cure are all the more tragic. Happily, my VA in-laws have had their first dose. So have many healthcare and at-risk friends nearby. However, my CT elders are still waiting.
Numbers
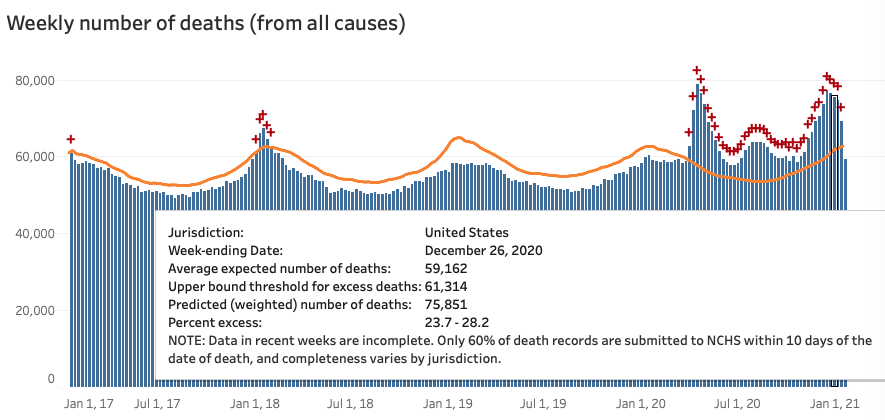
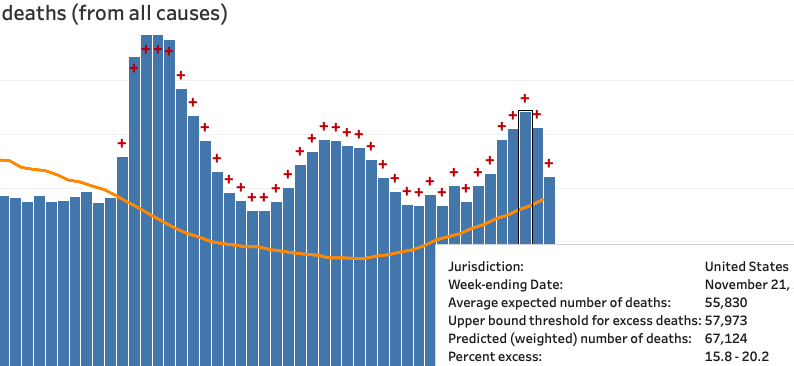
Whatever you think of the daily COVID counts, total deaths is pretty solid. And there are over 400K excess deaths (all causes) for 2020. That’s a lot. As expected, the December deaths rose to match April’s, despite some foolish (or malicious) contrarian claims in early November.
| CDC Excess Deaths Count | |
|---|---|
Now (January 31, 2021)
|
Last month - detail
|
A remaining puzzle
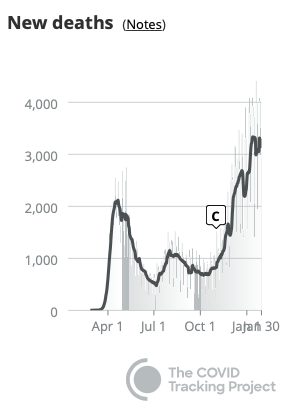 But do the December excess deaths (above) match the **3,000/day average** COVID-19 daily death reports (right)? No. The December daily count is 50% higher than April (3,000 vs 2,000). That's an extra 7,000 deaths per week vs. April - but the CDC *total deaths* peaks are both about the same height. Where are those cases?
[Revisiting 23-May-2021.
* Total for the four April weeks (ending 25 Apr): 302K.
* Total for the four December weeks (ending 26 Dec): 328K.
* That's a difference of 6.5K per week.]
But do the December excess deaths (above) match the **3,000/day average** COVID-19 daily death reports (right)? No. The December daily count is 50% higher than April (3,000 vs 2,000). That's an extra 7,000 deaths per week vs. April - but the CDC *total deaths* peaks are both about the same height. Where are those cases?
[Revisiting 23-May-2021.
* Total for the four April weeks (ending 25 Apr): 302K.
* Total for the four December weeks (ending 26 Dec): 328K.
* That's a difference of 6.5K per week.]
Lag?
One answer is regular lag. Based on past lag, we expect the top bars to get another 2,000 or so as more certificates flow in. That would still keep them roughly on par with April. So that won’t do.
Special lag?
There could be extraordinary lag – prehaps due to volume, or holiday delays. But it feels ad hoc. In its favor, a 2016 paper found that it took 13 weeks to get to 84% of all-cause deaths, and twice that to get to 95%. Okay, but 4-6 weeks has worked most of 2020. Is there independent reason to think the reporting system has slowed? [Charles goes and checks.] Hm, yes. At least the CDC says so in their weekly report:
Longer delays in reporting of hospitalization and mortality data may occur due to the holidays and the large number of COVID-19 illnesses occurring in recent weeks.
Still… could it be something else?
[The numbers above suggest extraordinary lag is the explanation.]Displacement?
Maybe COVID is displacing other deaths via a combination of: (1) Miscounting, (2) Harvesting, and (3) “On Balance”.
-
Miscounting: Yes, 3,000 people are dying daily of “PIC” – Pneumonia, Influenza-like illnesses, and COVID-19. But 1,000 of those are actually the usual (non-COVID) P and I, getting miscounted.
-
Harvesting: Maybe all 3,000 are COVID-19, but 1,000 would have died anyway within say 4 months.
-
On Balance: Yes, 3,000 die from COVID-19. Also, far fewer are dying of other causes, esp. (non-COVID) P and I.
Miscounting
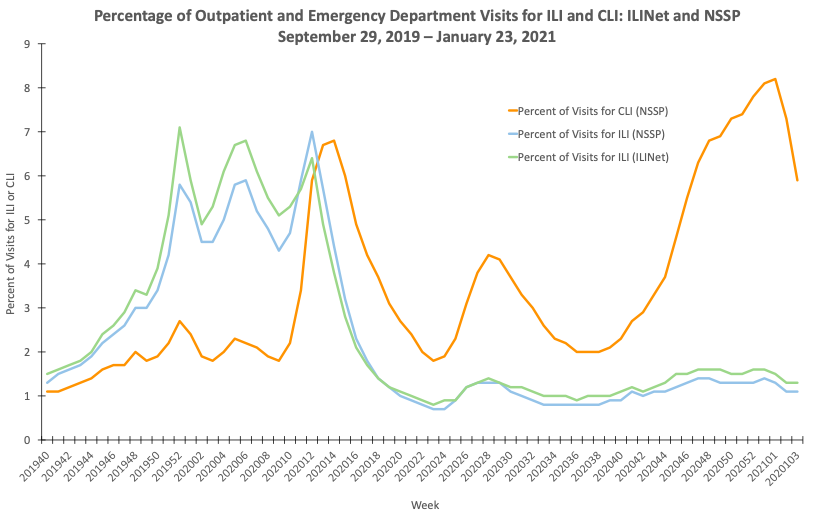
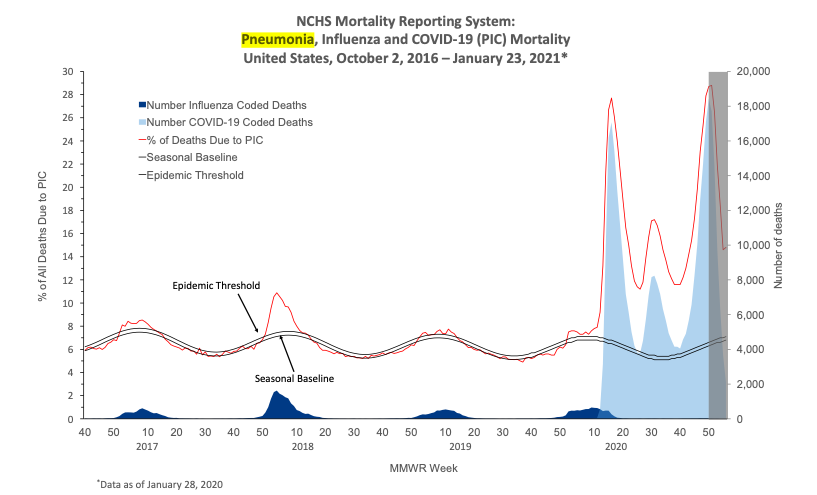
Miscounting would be the most embarrassing for those involved. Can we test it? In it’s favor, the same weekly report quoted above says the ILI-net is receiving far fewer visits, as people avoid the usual doctor’s office and ER for diagnosis, or only go when they suspect COVID. We can also see essentially no influenza-coded deaths so far this winter (second chart).
ILI-net visits
|
Influenza-Coded Deaths (dark blue)
|
Still, maybe the sum of all non-COVID deaths will account for a portion of those 1,000. Testable.
Harvesting / On Balance?
In Harvesting, a younger, faster Reaper beats the old man to the punch. Same people die, just sooner, of a different thing. So fewer excess deaths than COVID-19 deaths. On balance, we get 3,000 daily COVID deaths, but an excess death count of only 2,000.
It need not even be the same people, as long as on balance the numbers match. COVID-19 is much more transmissible, so interventions that keep it around R=1 (as we have) would drastically curtail flu etc. That seems to have happened during Australia’s winter.
So…
I like to think the CovidTracking hospitalization & deaths counts are reliable. But that seems to imply a 50% rise in December’s CDC deaths count, vs. now when it basically equals April’s peak. [I meant 50% rise in excess deaths. But I was wrong. Area under the curve, not peak-to-peak. A 25% rise in excess deaths accounted for the 7,000/week extra.] So, after that exercise, what are my intuitive guesses:
- Regular lag: +2,000 deaths per week
- Extra lag: +3,000 more
- Miscounting, Harvesting, On balance: +2,000 total
[ Looks now like regular + extra lag just about covers it. ]
If that’s right we’ll see the December total death certificates peaks rise by ~5,000 cases. That still feels high.
Coda
In the meantime, I pray we stay well, avoid making others ill, and update our beliefs with new evidence.