Note: read this paper: stronger LLMs exhibit more cognitive bias. If robust, that would be a very promising result., as I noted in my comment to Kris Wheaton here.

Note: read this paper: stronger LLMs exhibit more cognitive bias. If robust, that would be a very promising result., as I noted in my comment to Kris Wheaton here.
| ❝ | Infant mortality, the telltale metric that led him to predict the Soviet collapse half a century ago, is higher in Mr. Biden’s America (5.4 per thousand) than in Mr. Putin’s Russia. |
~NYT on [Emmanual Todd & the Decline of the West](https://www.nytimes.com/2024/03/09/opinion/emmanuel-todd-decline-west.html)
The US has infant and maternal mortality problems, but is it this bad, or is it just Russia finally catching up?

But here’s a combined trend using Macrotrend’s data, from 1960-2024 (omitting Russia’s disastrous 1950s). Even this data has the US slowly improving, so the story is Russia catching up.

Possibly relevant: birth rates are similar at 11 & 12 per thousand (Macrotrends).
Either way, Russia is close to the US now, and I’m surprised – my impressions were outdated. But this graph doesn’t seem cause for concern about the US. Comparison to peer democracies might. I’d have to read Todd’s book for the argument.
A specialist in the anthropology of families, Mr. Todd warns that a lot of the values Americans are currently spreading are less universal than Americans think.
Which thought continues:
In a similar way, during the Cold War, the Soviet Union’s official atheism was a deal-breaker for many people who might otherwise have been well disposed toward Communism.
And despite the US haing ~2.5x Russia’s population (per US Census):
Mr. Todd calculates that the United States produces fewer engineers than Russia does, not just per capita but in absolute numbers.
Though this may reflect his values for what counts as productive (my emphasis):
It is experiencing an “internal brain drain,” as its young people drift from demanding, high-skill, high-value-added occupations to law, finance and various occupations that merely transfer value around the economy and in some cases may even destroy it. (He asks us to consider the ravages of the opioid industry, for instance.)
A Berkeley Computer Science lab just uploaded “Approaching Human-Level Forecasting with Language Models” to arXiv DOI:10.48550/arXiv.2402.18563. My take:
There were three things that helped: Study, Scale, and Search, but the greatest of these is Search.
Halawi et al replicated earlier results that off-the-shelf LLMs can’t forecast, then showed how to make them better. Quickly:
Adding news search and fine tuning, the LLMs were decent (Brier .179), and well-calibrated. Not nearly as good as the crowd (.149), but probably (I’m guessing) better than the median forecaster – most of crowd accuracy is usually carried by the top few %. I’m surprised by the calibration.

By far the biggest gain was adding Info-Retrieval (Brier .206 -> .186), especially when it found at least 5 relevant articles.
With respect to retrieval, our system nears the performance of the crowd when there are at least 5 relevant articles. We further observe that as the number of articles increases, our Brier score improves and surpasses the crowd’s (Figure 4a). Intuitively, our system relies on high-quality retrieval, and when conditioned on more articles, it performs better.
Note: they worked to avoid information leakage. The test set only used questions published after the models' cutoff date, and they did sanity checks to ensure the model didn’t already know events after the cutoff date (and did know events before it!). New retrieval used APIs that allowed cutoff dates, so they could simulate more information becoming available during the life of the question. Retrieval dates were sampled based on advertised question closing date, not actual resolution.
Fine-tuning the model improved versus baseline: (.186 -> .179) for the full system, with variants at 0.181-0.183. If I understand correctly, it was trained on model forecasts of training data which had outperformed the crowd but not by too much, to mitigate overconfidence.
That last adjustment – good but not too good – suggests there are still a lot of judgmental knobs to twiddle, risking a garden of forking paths. However, assuming no actual flaws like information leakage, the paper stands as an existence proof of decent forecasting, though not a representative sample of what replication-of-method would find.
GPT4 did a little better than GPT3.5. (.179 vs .182). And a lot better than lunchbox models like Llama-2.
But it’s not just scale, as you can see below: Llama’s 13B model outperforms its 70B, by a lot. Maybe sophistication would be a better word, but that’s too many syllables for a slogan.

Calibration: was surprisingly good. Some of that probably comes from the careful selection of forecasts to fine-tune from, and some likely from the crowd-within style setup where the model forecast is the trimmed mean from at least 16 different forecasts it generated for the question. [Update: the [Schoenegger et al] paper (also this week) ensembled 12 different LLMs and got worse calibration. Fine tuning has my vote now.]
Forking Paths: They did a hyperparameter search to optimize system configuration like the the choice of aggregation function (trimmed mean), as well as retrieval and prompting strategies. This bothers me less than it might because (1) adding good article retrieval matters more than all the other steps; (2) hyperparameter search can itself be specified and replicated (though I bet the choice of good-but-not-great for training forecasts was ad hoc), and (3) the paper is an existence proof.
Quality: It’s about 20% worse than the crowd forecast. I would like to know where it forms in crowd %ile. However, it’s different enough from the crowd that mixing them at 4:1 (crowd:model) improved the aggregate.
They note the system had biggest Brier gains when the crowd was guessing near 0.5, but I’m unimpressed. (1) this seems of little practical importance, especially if those questions really are uncertain, (2) it’s still only taking Brier of .24 -> .237, nothing to write home about, and (3) it’s too post-hoc, drawing the target after taking the shots.
Overall: A surprising amount of forecasting is nowcasting, and this is something LLMs with good search and inference could indeed get good at. At minimum they could do the initial sweep on a question, or set better priors. I would imagine that marrying LLMs with Argument Mapping could improve things even more.
This paper looks like a good start.
Adam Russell created the DARPA SCORE replication project. Here he reflects on the importance of Intelligible Failure.
[Advanced Research Projects Agencies] need intelligible failure to learn from the bets they take. And that means evaluating risks taken (or not) and understanding—not merely observing—failures achieved, which requires both brains and guts. That brings me back to the hardest problem in making failure intelligible: ourselves. Perhaps the neologism we really need going forward is for intelligible failure itself—to distinguish it, as a virtue, from the kind of failure that we never want to celebrate: the unintelligible failure, immeasurable, born of sloppiness, carelessness, expediency, low standards, or incompetence, with no way to know how or even if it contributed to real progress.
🔖 Old-fashioned confusion, a forecasting blog by Foretell forecaster kojif.
The July 5 Lancet letter reaffirms the authors' earlier skeptical view of LabLeak. They cited some new studies and some older pieces in favor of Zoonosis. Summary of those sources below. (This post was originally a CSET-Foretell comment.)
(Limitation: I’m summarizing expert arguments - I can evaluate arguments and statistics, but I have to rely on experts for the core biology. )
Cell July 9: Four novel SARS-CoV-2-related viruses sequenced from samples; RpYN06 is now second after RaTG13, and closest in most of the genome, but farther in spike protein. Also, eco models suggest broad range for bats in Asia, despite most samples coming from a small area of Yunnan. The upshot is that moderate looking found more related strains, implying there are plenty more out there. Also, a wider range for bats suggests there may be populations closer to Wuhan, or to its farm suppliers.
May 12 Virological post by RF Garry: Thinks WHO report has new data favoring zoonotic, namely that the 47 Huanan market cases were all Lineage B, and closely-related consistent with a super-spreader; however, at least some of the 38 other-market cases were Lineage A. Both lineages spread from Wuhan out. Zoonosis posits Lineage A diverged into Lineage B at a wildlife farm or during transport, and both spread to different markets/humans. LabLeak posits Lineage A in the lab, diverging either there or during/after escape. Garry thinks it’s harder to account for different strains specifically in different markets. And the linking of early cases to the markets, just like the earlier SARS-CoV. A responder argues for direct bat-to-human transfer. Another argues that cryptic human spread, only noticed after market super-spread events, renders the data compatible with either theory.
Older (Feb) Nature: Sequenced 5 Thai bats; Bats in colony with RmYN02 have neutralizing antibodies for SARS-CoV-2. Extends geog. distribution of related CoVs to 4800km.
June Nature Explainer: tries to sort un/known. “Most scientists” favor zoonosis, but LL “has not been ruled out”. “Most emerging infectious diseases begin with a spillover from nature” and “not yet any substantial evidence for a lab leak”. Bats are known carriers and RATG13 tags them, but 96% isn’t close enough - a closer relative remains unknown. “Although lab leaks have never caused an epidemic, they have resulted in small outbreaks”. [I sense specious reasoning there from small sample, but to their credit they point out there have been similar escapes that got contained.] They then consider five args for LL: (1) why no host found yet? (2) Coincidence first found next to WIV? (3) Unusual genetic features signal engineering (4) Spreads too well among humans. (5) Samples from the “death mine” bats at WIV may be the source. In each case they argue this might not favor LL, or not much. Mostly decent replies, moving the likelihood ratio of these closer to 1.0, which means 0 evidence either way.
Justin Ling’s piece in FP: I’m not a fan. As I’ve argued elsewhere, it’s uneven at best. Citing it almost count agains them. Still, mixed in with a good dose of straw-man emotional arguments, Ling rallies in the last 1/3 to raise some good points. But really just read the Nature Explainer.
I think collectively the sources they cite do support their position, or more specifically, they weaken some of the arguments for LabLeak by showing we might expect that evidence even under Zoonosis. The argument summaries:
Pro-Z: (a) Zoonosis has a solid portfolio; (b) There’s way more bats out there than first supposed; (c) There’s way more viruses in them bats; (d) Implicit, but there’s way more bush meat too;
Anti-LL: Key args for LabLeak are almost as likely under zoonosis. Although not mentioned here, that would, alas, include China’s squirreliness.
Based on these I revised my LL forecast from 67% ➛ 61%. The authors put it somewhere below 50%, probably below 10%. Fauci said “very, very, very, very remote possibility”. That seems at most 1:1000, as “remote” is normally <5%. Foretell and Metaculus are about 33%, so I may be too high, but I think we discounted LL too much early on.
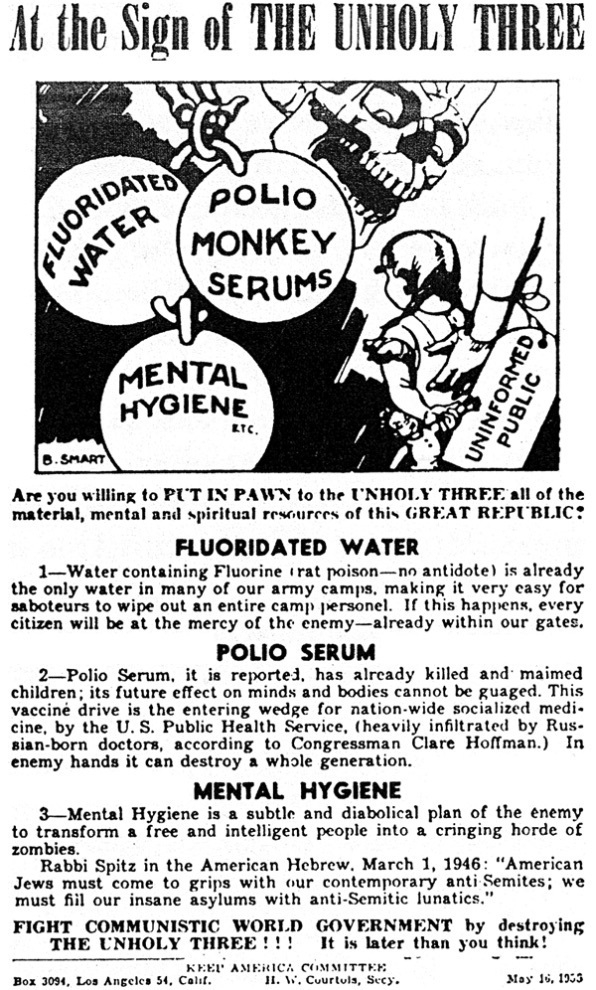
The apparent discrepancy November/December discrepancy between higher CovidTracking counts (COVID19 deaths) and lower CDC official excess death counts has essentially vanished.
The actual excess deaths amount to +6,500 per week for December. There was just a lot of lag.
I give myself some credit for considering that I might be in a bubble, that my faith in the two reporting systems might be too strong misplaced, and looking for alternate explanations.
But in the end I was too timid in their defense: I thought only about 5K of the 7K discrepancy would be lag, and that we would see a larger role of harvesting, for example.

Congratulations to Michael Gordon et al for their paper in PLoS One!
This paper combines the results of four previous replication market studies. Data & scripts are in the pooledmaRket R package.
Key points:
Enough summarizing - it’s open access, go read it! 😀🔬📄
~ ~ ~
We used this knowledge in the Replication Markets project, but it took awhile to get into print, as it does.
It should be possible to get 80-90% accuracy:
Replication Markets probably did worse ☹️, but another team may have done better. TBD.
HTT Nuño Sempere’s January forecasting newsletter. And be sure to check out his marvelous Metaforecast service!
~ ~ ~
So: Metacululs and RootClaim give very different probabilities that COVID-19 originated in a lab (see earlier post summarizing Monk):
Metaculus has ~3K forecasts on that question over the last year+, and over 260 comments, most well-informed. They’ve done well in COVID-19 forecasts vs. experts. (And famously one of their top forecasters nailed the pandemic in late January 2020, as Sempere reminds us.)
Rootclaim, as far as I can tell, begins with some crowdsourcing to formulate hypotheses, get initial probabilities, gather sources, and maybe to help set likelihoods. Then they do a Bayesian update. At one point they used full Bayesian networks. It seems this one treats each evidence-group as independent.
Both are heavily rationalist and Bayesian-friendly, and had access to each other’s forecasts. So the divergence is quite interesting - I wish I had time to dig into it some more.
CDC total deaths snapshot: December weekly #s gained about 4,500 vs. two weeks ago: there are now 4 weeks right near 80K, slightly above the highest April week.
That’s bad. But still hard to square with covidtracking deaths being 50% higher than in April.
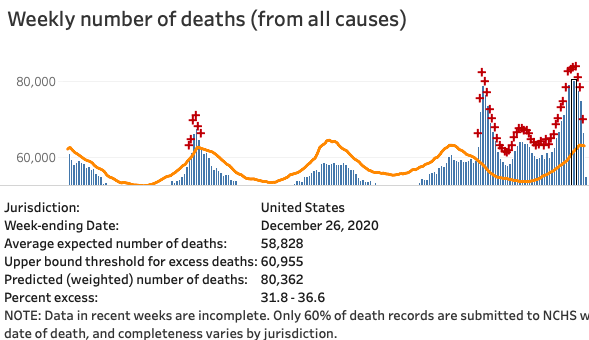
Week of 26-Dec is now at 81,406, up by ~1K. The week of 2-Jan is higher now, above 82K, gaining 1-2K.
 #### Update 23-May
December totals are now about +26K versus April, or about +6,500/week. That’s pretty much all the discrepancy I was concerned to explain.
That further supports the live CovidTracking numbers from last autumn.
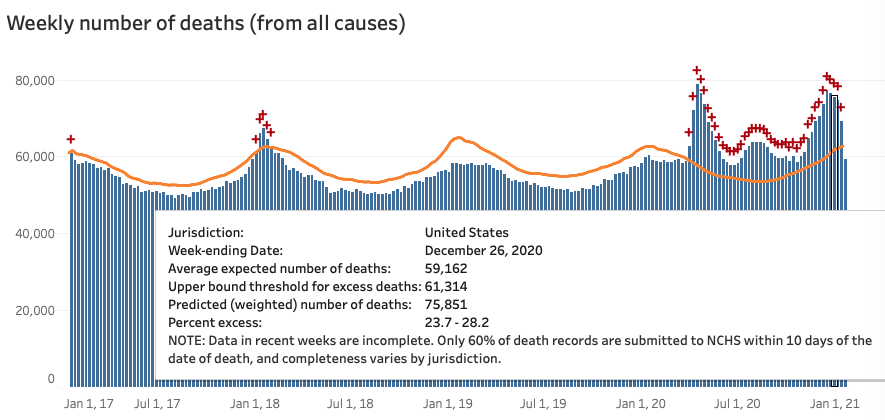
A friend notes that the US has a long of equating vaccines and public health with commie conspiracies. This from 1955, citing US Rep. Clare Hoffman.
What do today’s anti-vaxxers think of the polio vaccine?
~ ~ ~
Among the saner anti-vax objections is the observation that any prior exposure could lead to an overactive immune response in a later exposure – a leading explanation for the 1918 lethality. The careful objectors say simply, “we don’t know it won’t”. True, though I’d be curious whether their odds are notably different from pro-vaxxers. (Do they both agree we’re x% sure it won’t, and just value that differently, or do they have very different x?)
According to my social media, a popular version of the objection is that something is so wrong with the vaccine that half the vaccinated population dies in 5 years, from overreacting to the common cold, or some variant of “gray goo”. This appears to be as informed as the polio-vax scare above.
A stronger version would be that we recreate 1918, but bigger. Suppose SARS-COV-3 appears in 2048, and has a similar relationship that Spanish flu (1918) had to Russian flu (1889): those who got COV-2 (or its vaccine) have a hyperactive immune response. In a world where we don’t vaccinate now, maybe 1/3 of the population gets COV-2, and so suffers heightened mortality in 2048. In the world where we vaccinate everyone, the whole population faces heightened mortality in 2048.
A great deal turns on “heightened”. Like meteor strikes, the main force comes from an exceedingly rare worst-case event. If it’s worth spending on meteor defense, shouldn’t we “spend” to avoid a vaccine own-goal, however unlikely?
It’s worth remembering some things about 1918:
So the bookends choice looks more like:
Do nothing. COV-2 infects about 1/3 of the planet, and ~12M people die. So, about 10M more than now. COV-3 does something similar, but infection mortality is 1-3% among 28-year-olds, so globally we lose up to 1% of them. (Unless we’re prepared for it, and prevent secondary infections.)
Vaccinate. COV-2 stops relatively soon, so maybe 5M total (using Metaculus' forecast for end of 2021.) COV-3 does something similar, but now peak infection mortality among 28-year-olds olds is more like 3-9%, so globally we lose 1-3% of them. (Unless we’re prepared for it.)
Scenario 2 is bleak enough - and you can tweak it to be worse. But in this 1918-specific version, it’s mostly an argument against vaccinating the pregnant and very young. Two groups we already tend to exclude.
But that’s just one scenario. Presumably whatever happens won’t look exactly like 1918. We don’t know what it will look like. But we do know we can probably save 7M lives now by vaccinating. The weight of the “what if” scenarios might be a good argument for limiting vaccination to some degree (just in case), but seem a poor argument against not doing it at all.
Thought exercise: suppose the fastest, cheapest, best way to immunize the population was via GMO corn? I assume it would have no effect on the arguments. But would it shift the battle lines?
[Edit: the thought exercise is not intended as a desirable alternative. It’s here to pump intuition among pro-vax but anti-GMO folks, as the argument outlined above seems similar to anti-GMO arguments. ]
[Edited 2021-02-02 to shorten and include Alexis' suggestion. -crt] [2021-05-23 Updated the CDC “excess death” numbers at the end. tl;dr they went up even more than required. 84,715 for the week of Dec. 26.]
In The Vaccine’s Race Against Time, Andrew Sullivan remembers his experience at the end of the US AIDS epidemic, and reminds us that “plagues … often finish strong.” It’s a good read.
At my church’s weekly service, we used to have general prayers like, “For all those suffering from COVID-19”. But since late autumn it seems we’ve had more specific prayers for parents, siblings, kids struggling with it. Half a dozen in recent weeks. Maybe dropping off now - let’s hope.
Happily the US is vaccinating, if unevenly. Sullivan urges us to continue other measures, because deaths after the cure are all the more tragic. Happily, my VA in-laws have had their first dose. So have many healthcare and at-risk friends nearby. However, my CT elders are still waiting.
Whatever you think of the daily COVID counts, total deaths is pretty solid. And there are over 400K excess deaths (all causes) for 2020. That’s a lot. As expected, the December deaths rose to match April’s, despite some foolish (or malicious) contrarian claims in early November.
| CDC Excess Deaths Count | |
|---|---|
Now (January 31, 2021)
|
Last month - detail
|
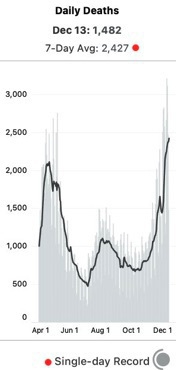
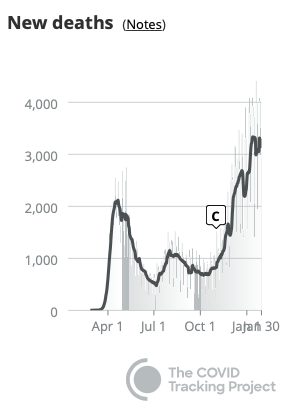 But do the December excess deaths (above) match the **3,000/day average** COVID-19 daily death reports (right)? No. The December daily count is 50% higher than April (3,000 vs 2,000). That's an extra 7,000 deaths per week vs. April - but the CDC *total deaths* peaks are both about the same height. Where are those cases?
[Revisiting 23-May-2021.
* Total for the four April weeks (ending 25 Apr): 302K.
* Total for the four December weeks (ending 26 Dec): 328K.
* That's a difference of 6.5K per week.]
But do the December excess deaths (above) match the **3,000/day average** COVID-19 daily death reports (right)? No. The December daily count is 50% higher than April (3,000 vs 2,000). That's an extra 7,000 deaths per week vs. April - but the CDC *total deaths* peaks are both about the same height. Where are those cases?
[Revisiting 23-May-2021.
* Total for the four April weeks (ending 25 Apr): 302K.
* Total for the four December weeks (ending 26 Dec): 328K.
* That's a difference of 6.5K per week.]
One answer is regular lag. Based on past lag, we expect the top bars to get another 2,000 or so as more certificates flow in. That would still keep them roughly on par with April. So that won’t do.
There could be extraordinary lag – prehaps due to volume, or holiday delays. But it feels ad hoc. In its favor, a 2016 paper found that it took 13 weeks to get to 84% of all-cause deaths, and twice that to get to 95%. Okay, but 4-6 weeks has worked most of 2020. Is there independent reason to think the reporting system has slowed? [Charles goes and checks.] Hm, yes. At least the CDC says so in their weekly report:
Longer delays in reporting of hospitalization and mortality data may occur due to the holidays and the large number of COVID-19 illnesses occurring in recent weeks.
Still… could it be something else?
[The numbers above suggest extraordinary lag is the explanation.]Maybe COVID is displacing other deaths via a combination of: (1) Miscounting, (2) Harvesting, and (3) “On Balance”.
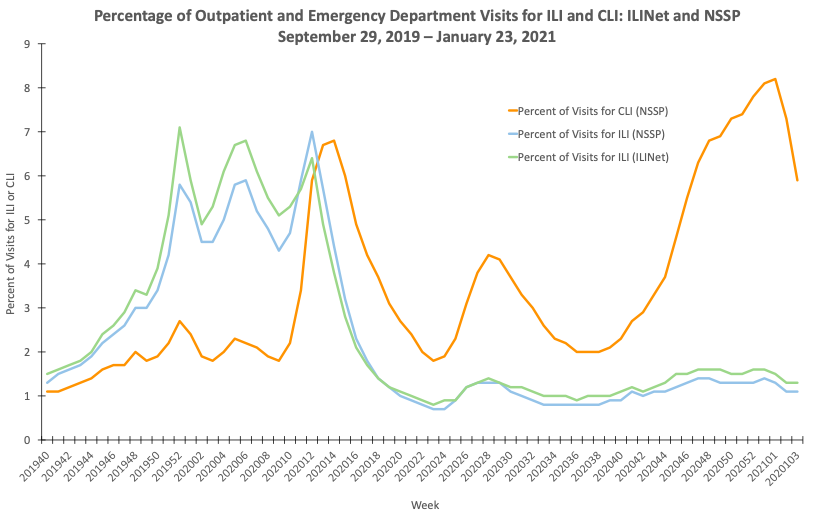
Miscounting: Yes, 3,000 people are dying daily of “PIC” – Pneumonia, Influenza-like illnesses, and COVID-19. But 1,000 of those are actually the usual (non-COVID) P and I, getting miscounted.
Harvesting: Maybe all 3,000 are COVID-19, but 1,000 would have died anyway within say 4 months.
On Balance: Yes, 3,000 die from COVID-19. Also, far fewer are dying of other causes, esp. (non-COVID) P and I.
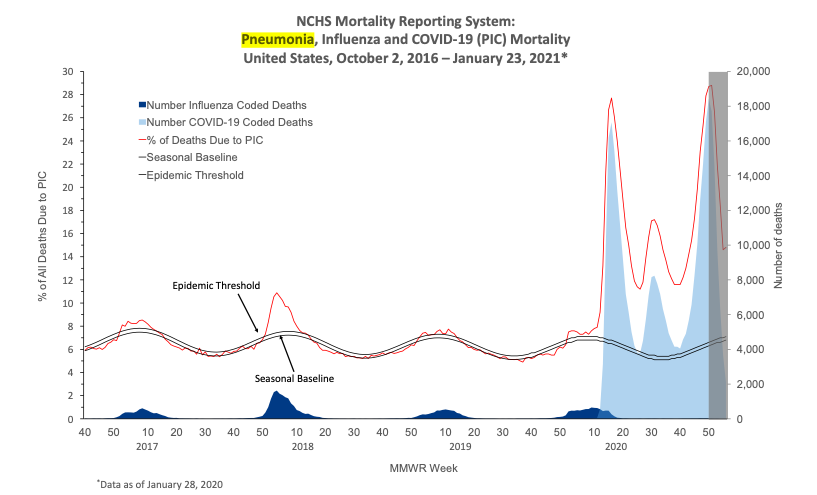
Miscounting would be the most embarrassing for those involved. Can we test it? In it’s favor, the same weekly report quoted above says the ILI-net is receiving far fewer visits, as people avoid the usual doctor’s office and ER for diagnosis, or only go when they suspect COVID. We can also see essentially no influenza-coded deaths so far this winter (second chart).
ILI-net visits
|
Influenza-Coded Deaths (dark blue)
|
Still, maybe the sum of all non-COVID deaths will account for a portion of those 1,000. Testable.
In Harvesting, a younger, faster Reaper beats the old man to the punch. Same people die, just sooner, of a different thing. So fewer excess deaths than COVID-19 deaths. On balance, we get 3,000 daily COVID deaths, but an excess death count of only 2,000.
It need not even be the same people, as long as on balance the numbers match. COVID-19 is much more transmissible, so interventions that keep it around R=1 (as we have) would drastically curtail flu etc. That seems to have happened during Australia’s winter.
I like to think the CovidTracking hospitalization & deaths counts are reliable. But that seems to imply a 50% rise in December’s CDC deaths count, vs. now when it basically equals April’s peak. [I meant 50% rise in excess deaths. But I was wrong. Area under the curve, not peak-to-peak. A 25% rise in excess deaths accounted for the 7,000/week extra.] So, after that exercise, what are my intuitive guesses:
[ Looks now like regular + extra lag just about covers it. ]
If that’s right we’ll see the December total death certificates peaks rise by ~5,000 cases. That still feels high.
In the meantime, I pray we stay well, avoid making others ill, and update our beliefs with new evidence.
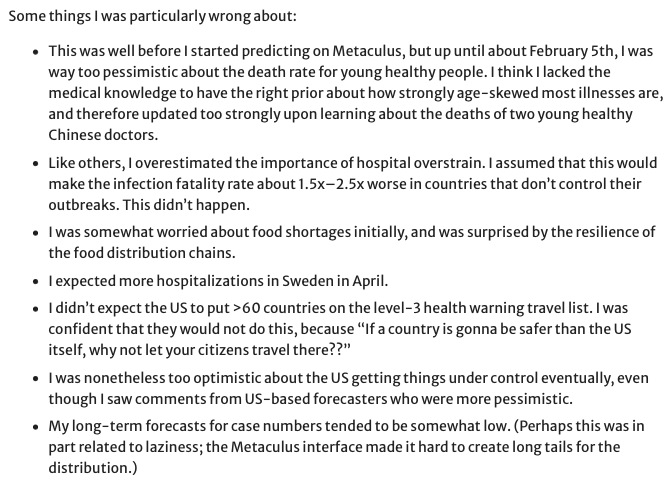
Wrong About
The winner of the Metaculus Li-Wenliang COVID-19 forecasting tournament was wrong about these. What about you?
Another great piece at Fantastic Anachronism: Are Experts Real.
I hadn’t heard about N=59. 😱
…if the N=59 crew are making such ridiculous errors in their own papers, they obviously don’t have the ability to judge other people’s…
In a discussion with @Somensi about excess deaths, I was puzzled by an apparent discrepancy between two sources that have both been reliable, insofar as I can tell:
The basic question from mid-December was how to reconcile this and this:
 |
 |
With this:
(Screenshots are from mid-Dec.)
In short, by early December it was clear that covidtracking.com had started diverging wildly from the CDC excess death counts. Two basic theories:
There’s a lot of noise on the thread, but @Somensi, who I don’t know, was also looking at data, and citing a good source. Doomsters like me have been using CDC excess data since April as evidence that the pandemic was real and could not be simple relabeling of flu deaths. Here the same source is cited to say the December spike couldn’t be real.
People on both sides who knew the CDC data understood it had a lag of 4 weeks or so – because it relies on actual death certificates completing all their procedural checks and getting filed. In 2016 it took 10 weeks for 80% of certificates to get filed. CDC now claims it gets to 60% in ~10 days. (There are plenty of people who don’t get the lag – it seems even to have tripped up JHU’s Dr. Briand, at least in her headline claim that there were no excess deaths in 2020.)
Problem: covidtracking is the most thoroughly-vetted weekly data source in the US. They’ve tracked the CDC excess deaths (after lag) the rest of the year. And reliably, their cases –predict–> hospitalizations 4 weeks later –predict–> deaths a few weeks later. The December death spike followed that pattern. Plausibly, CDC was just lagging.
Problem: CDC 4 weeks back should be pretty good, and it looked nothing like April. As my correspondent said, CDC data “would have to be lagging by an unprecedented amount."
It’s obvious once you see it.
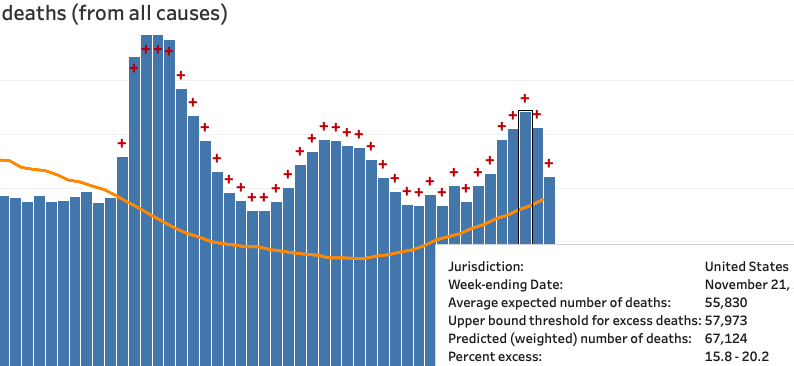
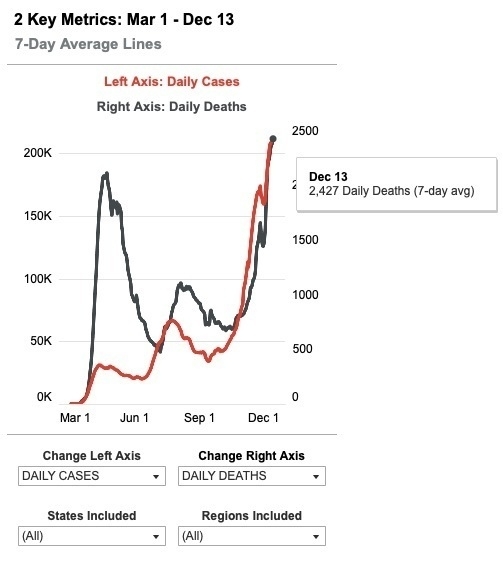
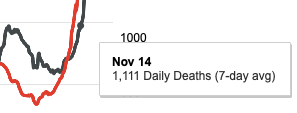
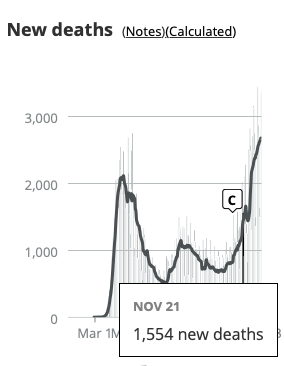
That death spike (swoop?) at the end is super fast. If you hover over the attributed deaths chart from covid-tracking, you find that the Nov. 14 cases are exactly in line with their July numbers, about half their April numbers. And in line with the mid-Nov. CDC numbers. The steep rise is mostly in the last 4 weeks.
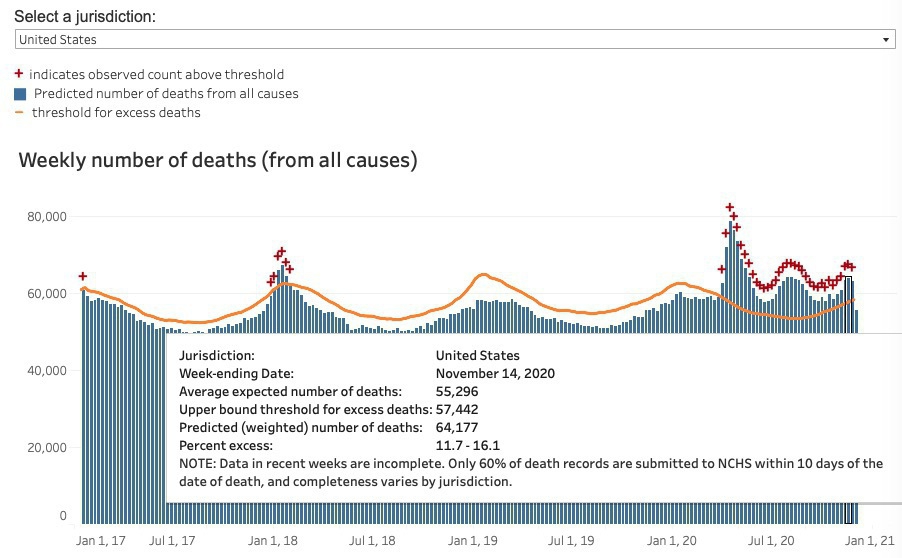
As of Dec. 23, we can look at how the CDC data has changed. Data should be pretty complete through Nov. 21. We see that Nov. 14 is now about 1,000 higher than before (and than the July peak), and Nov. 21 about 2,000 higher than that.
Not a swoop yet, but basically on par with the covidtracking chart week-for-week. Here that is again from today, highlighting Nov. 21. (The bold line is the 7-day moving average, a far better comparison than the daily total.)
We should definitely expect the CDC excess deaths count for December to reach April levels.
Dr. Rachel Thomas writes,
When we think about AI, we need to think about complicated real-world systems [because] decision-making happens within complicated real-world systems.
For example, bail/bond algorithms live in this world:
for public defenders to meet with defendants at Rikers Island, where many pre-trial detainees in NYC who can’t afford bail are held, involves a bus ride that is two hours each way and they then only get 30 minutes to see the defendant, assuming the guards are on time (which is not always the case)
Designed or not, this system leads innocents to plead guilty so they can leave jail faster than if they waited for a trial. I hope that was not the point.
Happily I don’t work bail/bond algorithms, but one decision tree is much like another. ”We do things right” means I need to ask more about decision context. We know decision theory - our customers don’t. Decisions should weigh the costs of false positives versus false negatives. It’s tempting to hand them the maximized ROC curve and make threshold choice Someone Else’s Problem. But Someone Else often accepts the default.
False positives abound in cyber-security. The lesser evil is being ignored like some nervous “check engine” light. The greater is being too easily believed. We can detect anomalies - but usually the customer has to investigate.
We can help by providing context. Does the system report confidence? Does it simply say “I don’t know?" when appropriate? Do we know the relative costs of misses and false alarms? Can the customer adjust those for the situation?
Science writer Christine Aschwanden (@cragcrest) just published a nice summary of the October paper “Crowdsourcing Hypothesis Tests” by Landy et al.
Well, half the paper.
I like the WIRED piece. It covers the main result: if you give a dozen labs a novel hypothesis to tetst, they devise about a dozen viable ways to test it, with variable results. So what?
Anna Dreber, an economist at the Stockholm School of Economics and an author on the project. “We researchers need to be way more careful now in how we say, ‘I’ve tested the hypothesis.’ You need to say, ‘I’ve tested it in this very specific way.’ Whether it generalizes to other settings is up to more research to show.”
We often neglect this ladder of specificity from theory to experiment and the inevitable rigor-relevance tradeoff, so measuring the effect puts some humility back into our always too-narrow error bars.
But Anschwanden’s subtitle hints at more:
Just how much wisdom is there in the scientific crowd?
Perhaps some paragraphs were cut, because in the second part of the paper, Landy et al asked a crowd to forecast the outcomes of each variant. In his prize-winning Metascience poster Domenico Viganola (@dviganola) summarized the result:
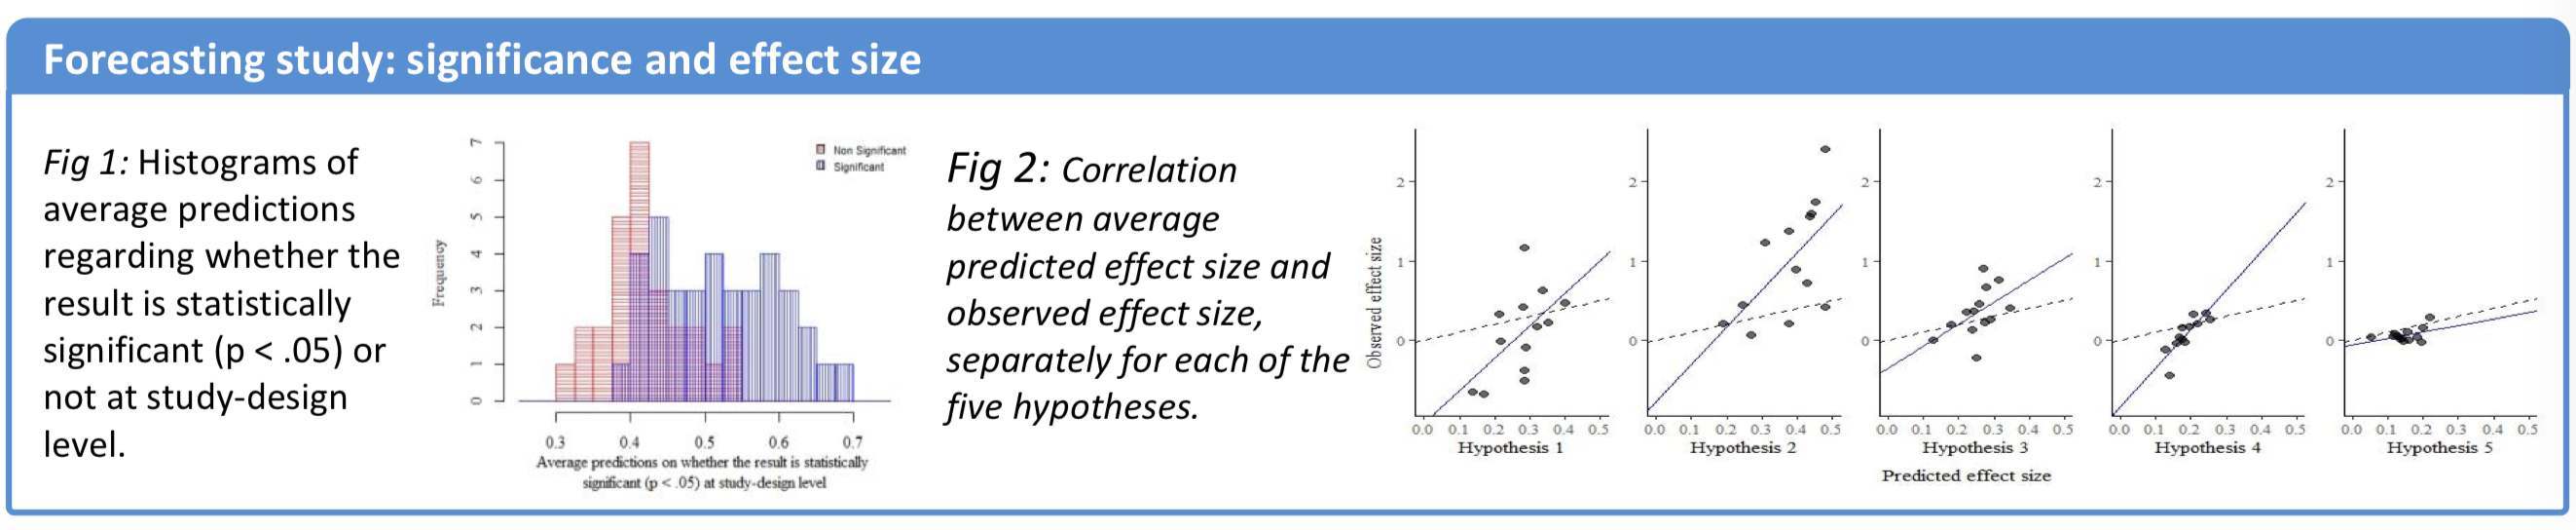
The scientific crowd was reasonably sensitive to the effect of the design variations from the different labs.
scientists’ predictions are positively correlated with the realized outcomes, both in terms of effect sizes and in terms of whether the result is statistically significant or not for the different sets of study materials.
And,
scientists were able to predict not only which hypotheses would receive empirical support (see Figure 3a) but also variability in results for the same hypothesis based on the design choices made by different research teams (see Figure 3b).
I think that’s pretty cool - and suggests there is reasonable wisdom in the scientific crowd.
But not quite enough wisdom to make this stud unnecessary.
Note: Dreber and Viganola are key part of the @ReplicationMkts team.
A friend sent a May 2018 Bloomberg article by Kit Chellel, “The gambler who cracked the horse-racing code."
It’s a good story of forecasting real-world events, and the interplay of statistical models and intuition/expertise to tune those models, and contains useful guides for @ReplicationMkts forecasters.
I was struck by this:
A breakthrough came when Benter hit on the idea of incorporating a data set hiding in plain sight: the Jockey Club’s publicly available betting odds.
That’s a surprising oversight. In his defense, 1990 was way before Wisdom of the Crowd, the Iowa Electronic Markets were just getting started, and Robin Hanson was only beginning to write about prediction markets. On the other hand, sports betting had been around for a long time. Anyway, the paragraph continues:
Building his own set of odds from scratch had been profitable, but he found that using the public odds as a starting point and refining them with his proprietary algorithm was dramatically more profitable. He considered the move his single most important innovation, and in the 1990-91 season, he said, he won about $3 million.
Well, of course. Those odds contain all the work already done by others.
There are at least three easy sources of prior wisdom in Replication Markets:
With attention you can do better than these - as Benter did in horse betting - but don’t ignore them. Here are two stories on correcting the market:
Yes, our markets are noisy. In SciCast, “faber” made much of his money with a simple bot that half-reversed wild trades by new accounts. So do this when it seems right - but note Faber’s first bot lost thousands of points to a savvy new opponent, before the bot gained backoff rules.
DAGGRE’s top forecaster regularly updated a spreadsheet of his best estimates. But his trading rule was to correct the market only halfway to his best estimate, and wait. The market might know something he doesn’t. (Also, market judo: trading +3% 10x is cheaper than changing +30% 1x.)
The article also mentions that Benter used the Kelly rule to stay ahead of gambler’s ruin. Kelly’s rule was an important early result in, and unorthodox application of, Shannon’s Information Theory.
The rule is based on the insight that a market - or set of markets - is a source of repeated returns, and you want to maximize your lifetime earnings. Therefore you must be as aggressive as you can while ensuring you never go broke. In theory, Kelly will never go broke - though in the real world (a) it’s still more aggressive than most can stomach, so most practitioners add a cushion, and (b) in the real world, there are usually either minimum bets or fees, so the guarantee becomes more of a tendency. But Kelly investors tend to do well, if they really do have an edge over the current market value.
Also, where Kelly solved the case for a single bet, in SciCast, we created a simplified Kelly algorithm for combinatorial bets.
Horse betting is a zero-sum game, like poker:
There was no law against what they were doing, but in a parimutuel gambling system, every dollar they won was a dollar lost by someone else
That’s not the case with Replication Markets. In LMSR-based markets, if ten people trade on a claim, and all raise the chance of the correct outcome, then they all win. The points come from the market maker - us.
We are also a play-money market - with prizes! - and we don’t charge transaction fees. Thanks to DARPA, who thinks it worthwhile to fund good estimates of the replicability of social science.